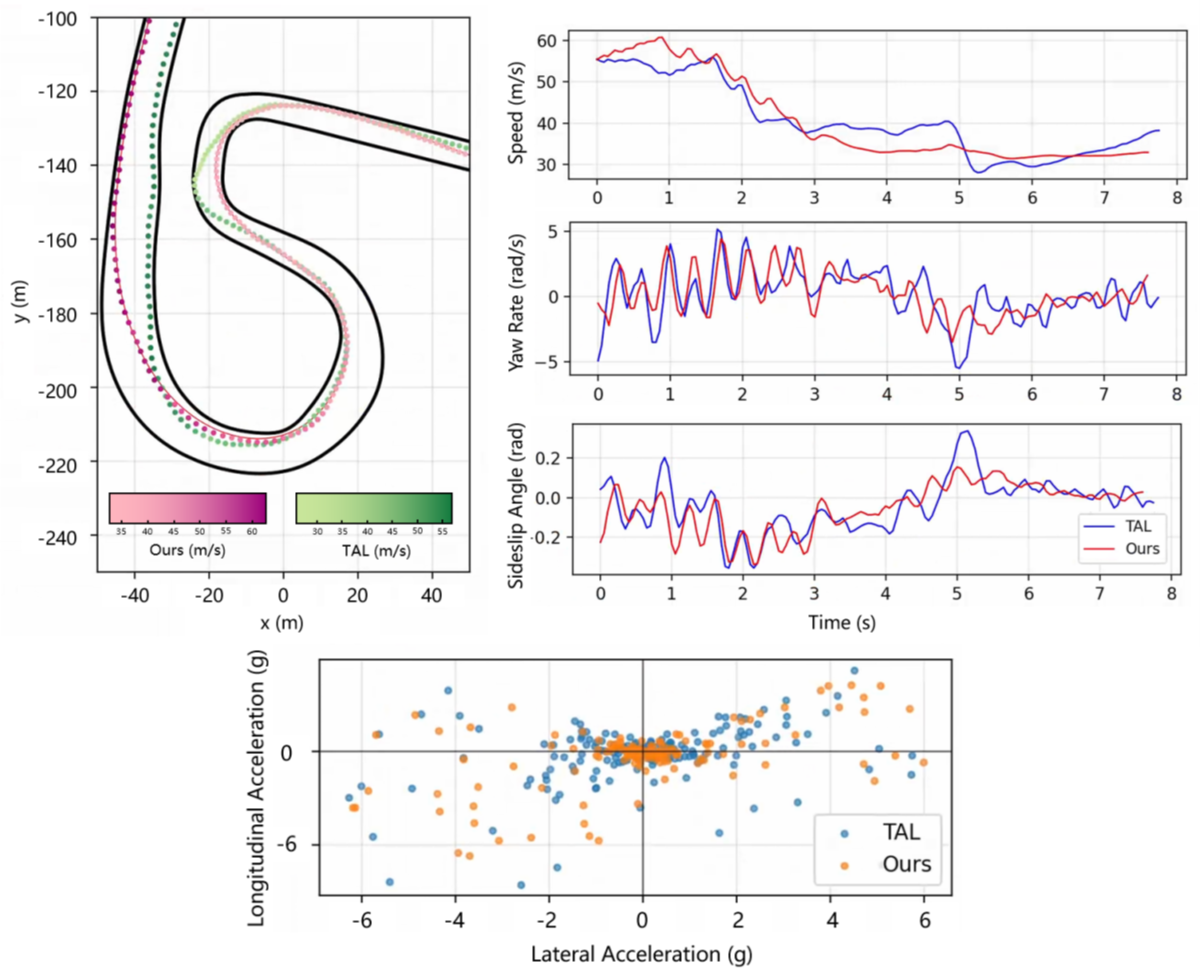
- We propose an Minimum Curvature Racing Line (MCRL)-guided state representation and reward shaping mechanism for autonomous racing. The pre-computed MCRL is encoded into a reference-augmented observation space and used to construct dense rewards related to trajectory tracking, target-speed following, and heading alignment. By constraining exploration around the reference priors, it alleviates the sparse-reward challenge in high-dimensional continuous action spaces and enables rapid convergence toward a high-performance policy that balances speed and stability.
- We introduce an explicit dynamics-constrained policy learning method based on vehicle dynamics priors. Yaw-rate and sideslip-angle limits are used to characterize a dynamics-based safe operating envelope, and their CBF-inspired safety margins are transformed into stability cost functions that are incorporated into policy optimization through Lagrangian relaxation. This mechanism regularizes unstable control behaviors during trial-and-error learning, thereby mitigating dynamic instability while maintaining sufficient exploration viability.
- We propose a progressive two-stage curriculum learning strategy. This strategy partitions the learning process into a trajectory guidance stage and a high-speed exploration stage. By implementing an easy-to-hard training schedule through this progressive reward formulation, we significantly enhance both the learning efficiency and the racing performance of the reinforcement learning agent.
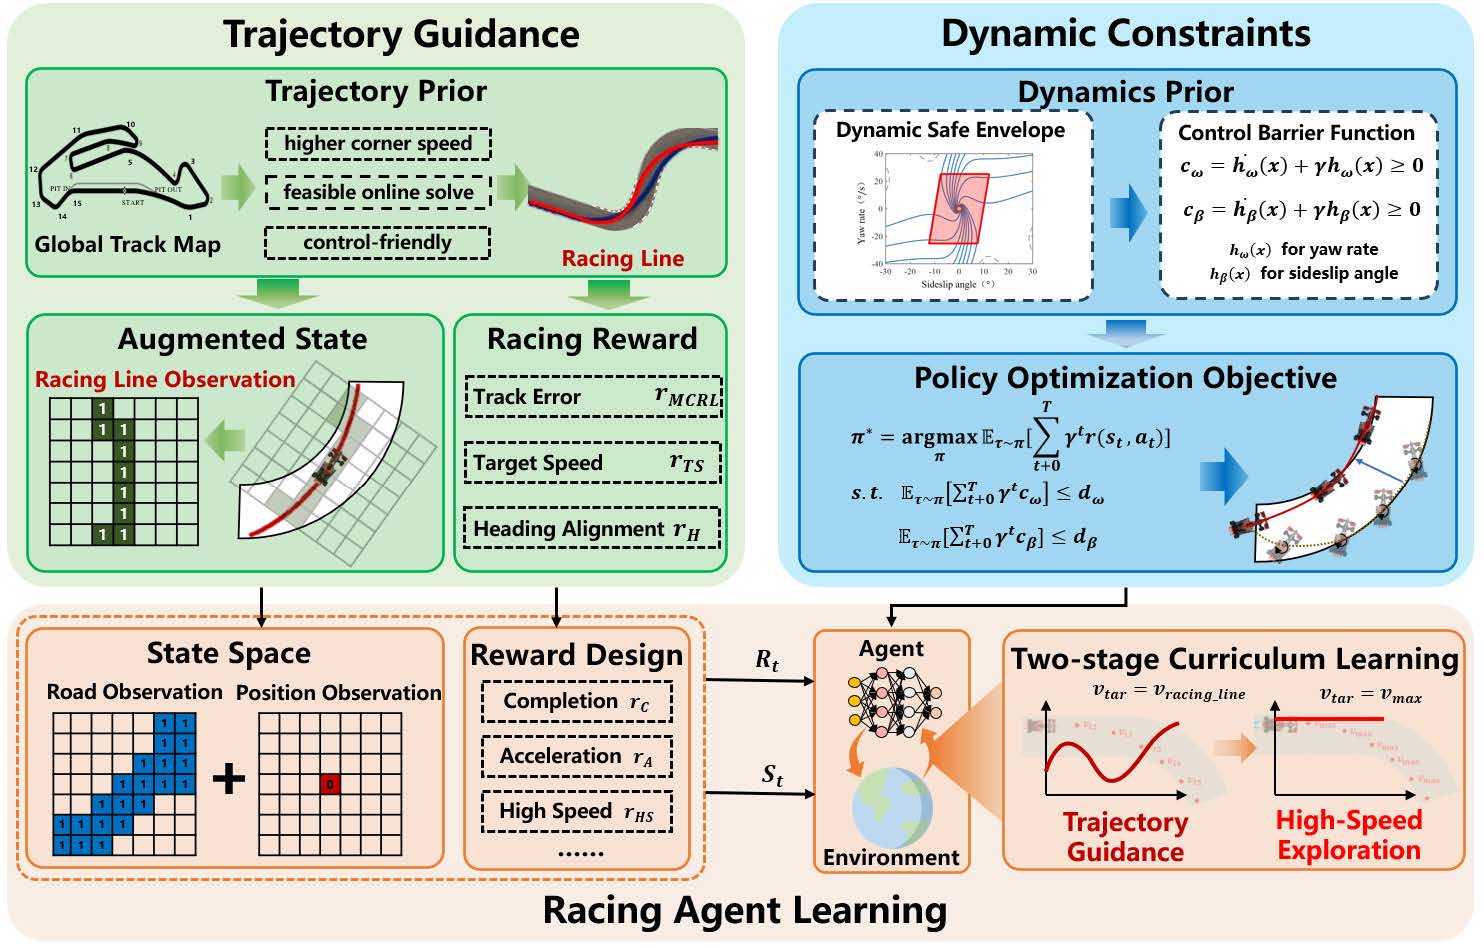
The reinforcement learning decision-making and control framework driven by expert prior knowledge. First, to tackle the issues of low exploration efficiency and the difficulty of learning optimal trajectories in complex racing environments, we encode track geometric priors and racing intent into structured guidance information using the racing line. This approach enhances the learning efficiency and stability of the agent within high-dimensional spaces. Second, to reduce the risk of instability inherent in high-speed racing, we explicitly introduce vehicle dynamics stability constraints during policy learning. By comprehensively considering two key stability indicators, yaw rate and sideslip angle, this mechanism mitigates unsafe dynamic behaviors and improves deployment potential. Finally, to fully exploit the racing potential while ensuring training convergence, we develop a two-stage curriculum learning strategy based on dynamic task evolution. This facilitates a smooth transition of the model’s capabilities toward limit-handling dynamic racing.